Application Insights integration with model-driven Power Apps explored
Microsoft has released a wealth of interesting new administration capabilities for Power Platform in the last few days. In my previous blog post I looked at the new tenant-level reports in Power Platform Admin Center. Today it’s time to dive into another preview: Analyze model-driven apps and Microsoft Dataverse telemetry with Application Insights.
Canvas apps have had a built-in integration with Azure Application Insights for over a year already. My colleague & canvas guru extraordinaire, Mr. Timo Pertilä, has written both an introduction and a deep dive blog post on that topic. While I do enjoy building simple canvas apps myself, too, at the end I’m a model-driven guy that can get the job done a lot quicker when given a Dataverse environment. So, this new integration finally inspired me to explore what capabilities Application Insights offers to app makers and admins.
Configuring Application Insights telemetry for your app’s environment
To get started, you should open Power Platform Admin Center (PPAC) and go to Analytics – Data export (preview). You’ll see the option to set up App Insights integration, which actually shares the configuration pane together with the Export to Data Lake feature (which I’ll cover in a future blog post). We see here that the Export to Application Insights feature is configured for one selected environment only, but you can run the wizard multiple times to add more environments later.

Before you can complete the configuration wizard, you’ll need an existing Azure resource for Application Insights, so check out the docs for how to create one. Once you’ve provisioned it & connected it to the Power Platform environment of your choice, data will start pouring in almost instantaneously.

Since the model-driven Power Apps are so deeply tied with data stored in Dataverse (although virtual tables are becoming a no-code option as well), this new Application Insights integration tracks both the client and server side actions resulting from end user app usage. Server calls to specific APIs may well be interesting for a highly customized Dynamics 365 system, for example, where you’ve got a bunch of plugins running custom logic and potentially connecting to external data sources.
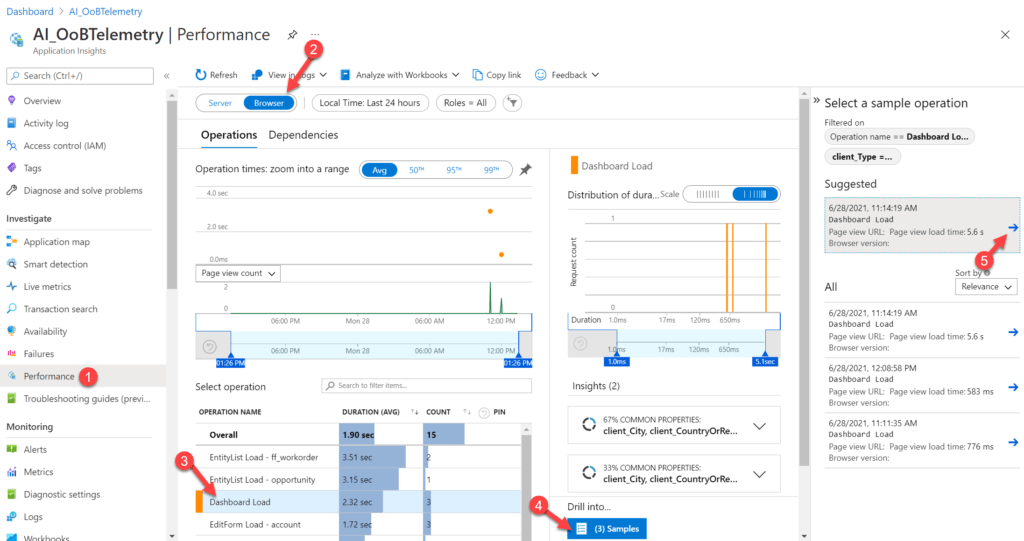
For exploration purposes the browser side activity is probably a better starting point. So, inside your Azure Portal and the Application Insights resource, go to Performance and choose Browser. You’ll see a list of operations that you can sort by longest average duration, for example. Open an operation of your choice, then click samples in the “drill into” section of the side pane. You’ll see a new pane open up with a list of tracked operations, where Application Insights is smart enough to suggest you drill into one that had a longer duration than the others.
In our example, we’re looking at a Dashboard Load operation. This is a good moment to check the documentation on available telemetry events for model-driven apps. Launch App, EntityList Load, EntityForm Load, Dashboard Load, QuickCreateFormLoad are types of events supported today, whereas a form save event or a click on the Command Bar buttons is not yet within the OoB scope of model-driven Power Apps telemetry. Especially the creation of a new row in the Dataverse table is probably something of high interest to customized apps, so keep this in mind when planning how you gather performance metrics for your business critical applications.

Drilling deeper into the Dashboard Load operation, we are presented with a detailed list of resources that a model-driven Power App will perform when requesting data from a multitude of different tables, web resources and other dashboard elements. The timeline view will illustrate how long each request has taken to complete and the side pane will show you all the details that a pro developer will be interested in reviewing.
What’s really neat about Application Insights is that User Timeline pane you see on the right. Understanding the path through which a specific user has navigated through within a specific session can potentially offer new insights into the actual app usage patterns. After all, Azure Application Insights is not just about troubleshooting events – it can be used for tracking variables like location, client type, user navigation flows, funnels for process stage completion and a wealth of other dimensions.

You can quickly build your own visualizations of the tracked events across an X and Y axis right within the Application Insights UI. This can be useful if you have identified a performance bottleneck experienced by the users that you need to resolve. Above we have a bar chart with the Web API requests per hour, grouped by performance. Below we see a line chart showing the number of active user sessions for your Model-driven Power App at any given time.

The full feature set of the Azure Monitor suite of services is of course at your disposal, with things like Log Analytics to keep you occupied for a long time. For more casual analysis of the app usage and performance, just knowing that all this telemetry data is available if needed should help the app admins and makers trust the platform for their business critical scenarios. There’s a free tier for many of the Azure Monitor services, but of course you should also “monitor the Monitor”, to understand how much capacity your app telemetry logs will consume over time.
Performance Insights without Application Insights
There’s another new feature that’s important to point out in the context of model-driven Power Apps monitoring. Whereas the Application Insights integration needs to be specifically set up before log data is available, we now have access to telemetry data collected automatically for every app, thanks to the Performance Insights preview.

You can open the Performance Insights from the Power Apps maker portal, behind the three dots for a model-driven app, and review the preconfigured performance metrics. These include daily summaries of how many users accessed what tables, what page load performance they had, which browsers did they use, were there any network issues identified, and so on. Instead of the raw log data from Application Insights, Microsoft provides verbal recommendations on how to address any issues identified automatically from the app’s telemetry data.
In a perfect world, every app you need to support would have its full telemetry data professionally tracked inside your Azure environment. In the real world, especially for consultants who need to troubleshoot the performance of model-driven Power Apps or Dynamics 365 CRM apps inside the customer’s environment, access to detailed log data may often not be available. Therefore this out-of-the-box Performance Insights feature is likely to become a common starting point for investigating app performance and errors, before moving into more detailed Application Insights data analysis.