SharePoint list and calculating sums with flow

Few years ago, I wrote about a Power App, which allows employees to indicate which days they are coming to the office. The solution is used in several organizations. After deployment, when data about the office days begins to accumulate, the first question is always the same.
“Would it be possible to send a summary to the kitchen on a daily basis of how many employees are coming to the office?”
With the use of the application, we accumulate data that can be utilized elsewhere as well. In this case, when evaluating the sales of lunches.
But how is this summary collected from a SharePoint list for the kitchen?
SharePoint list content
How does our application store the office usage data in the SharePoint list? Employees mark with the accuracy of a block (part of a floor) where they are coming to work each day. The app maintains data for one week at a time, for a rolling 10 days.
Columns in the list are
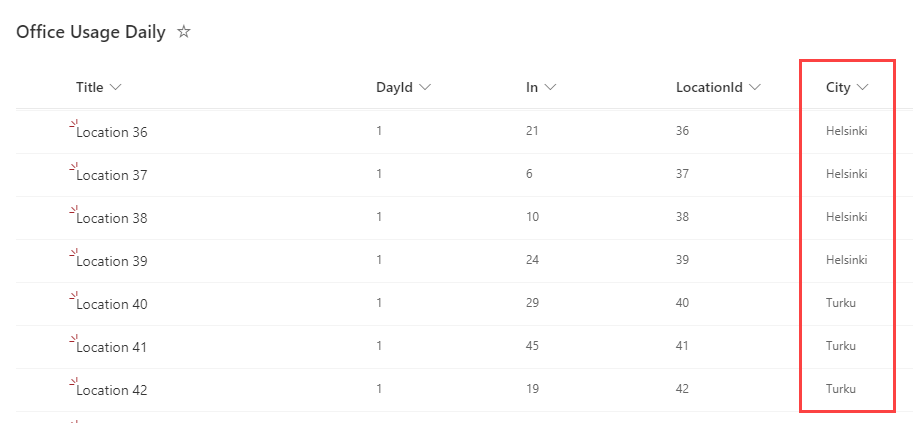
- Title: The name of the block
- LocationId: Block identifier
- DayId: What day is it (1 = 1st Monday of the week, 5 = 1st Friday of the week, etc.)
- In: How many employees are coming to that block
From the image below, we can see that 22 people are going to the Location 13 block on Monday of this week (DayId = 1). On the same day, 8 people are going to Location 14.

There are 100 blocks in our example. So there are exactly a thousand lines on the list.
Next, let’s calculate the daily number of visitors for the kitchen.
Calculating sums in Flow
The first thing that comes to mind, is to go through all the rows in flow and calculate the desired sums. Let’s take an example where the number of visitors for the first week (Day1 – Day5) are added together.
Let’s initialize a separate counter variable for each day.
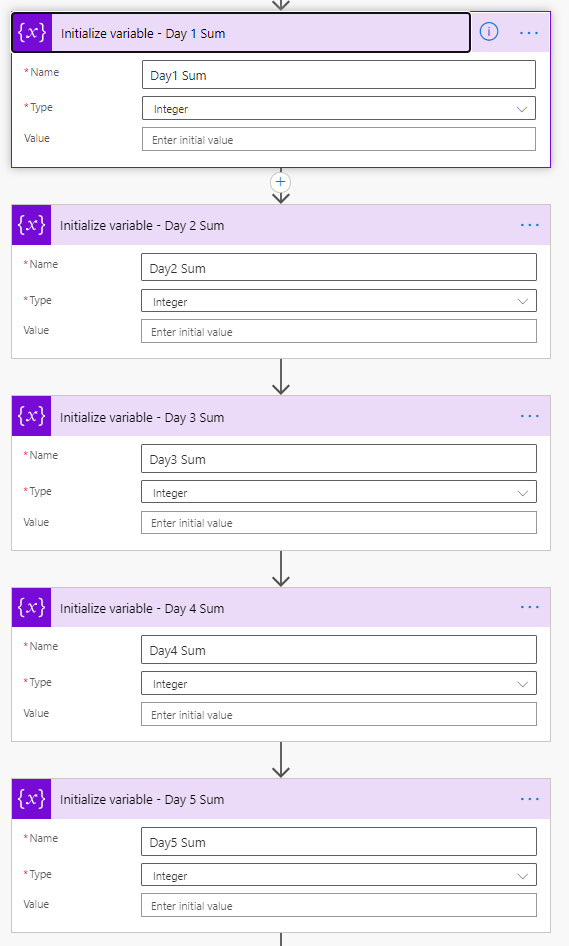
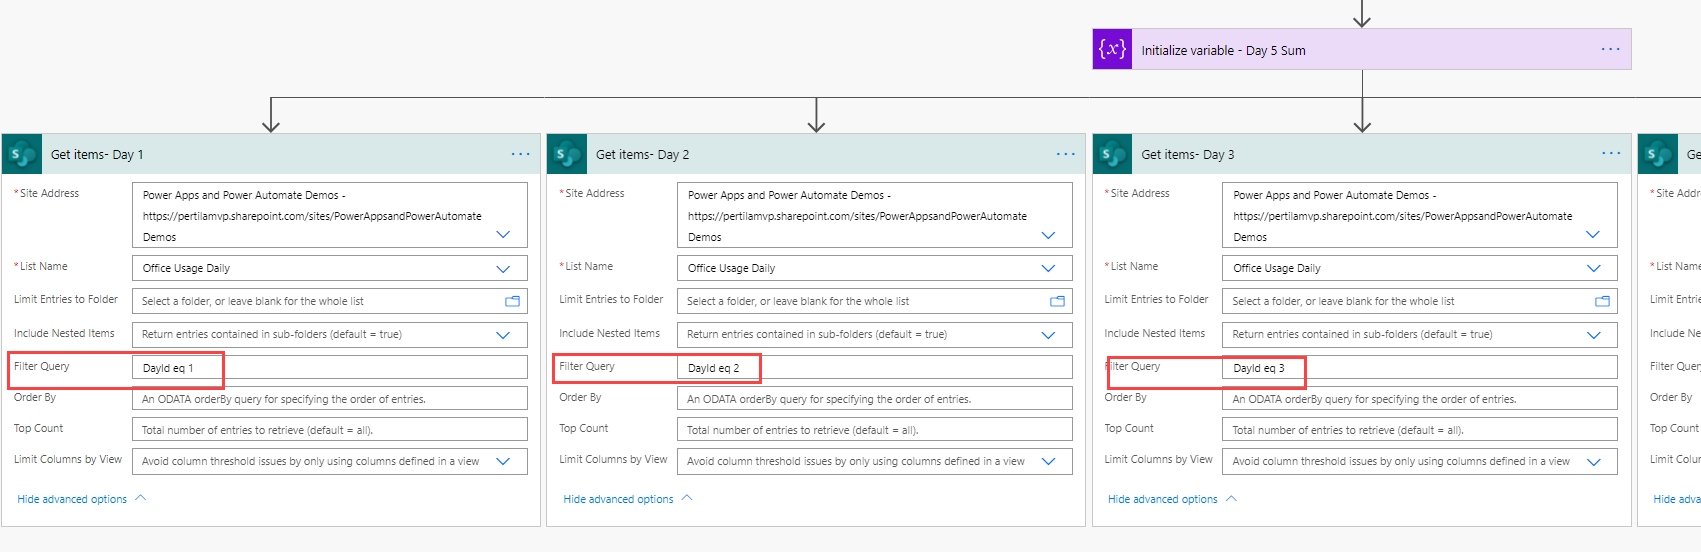
After this, the rows representing days 1-5 are retrieved in their own parallel branches (Get items action).
Finally, in each branch, the rows of the day are reviewed and the number of visitors is added together (In-values of each block). The In field (Field_In) must be changed to an integer separately for the flow to work properly.
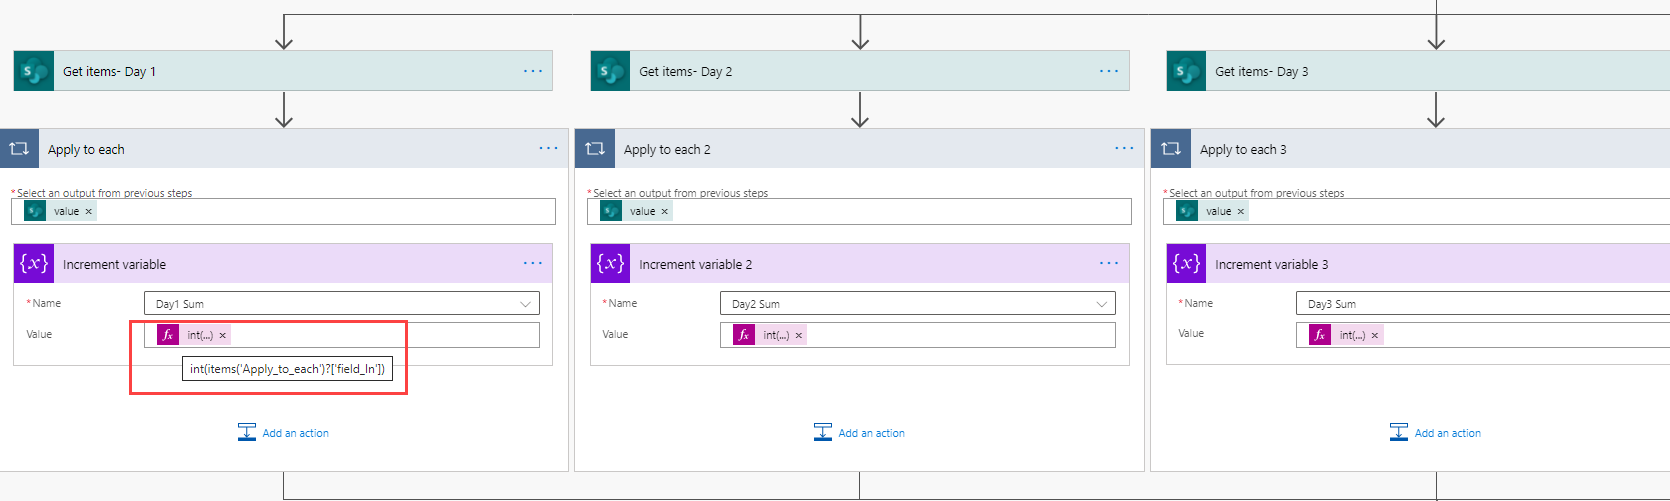
As a result, we know how many people are coming to the office on days 1-5.

What is the problem here?
First of all, the flow takes 30 seconds to complete.

Which is not great, but (this time) not the real problem.
Secondly, this is becoming a very complicated flow. We are only calculating the sum for five days, and the flow already looks like this.

In our example, there are 100 locations. Running the flow we generate 1012 Power Platform API calls. That’s more than half of an M365 user’s daily limit.
There must be a better way to do this.
Retrieving sums from a SharePoint list view
With Dataverse, sums can be easily extracted using function aggregation or FetchXML. With SharePoint, these options do not exist.
But what we can do, is create versatile views in a SharePoint list.
Creating a view
Let’s create a new view for our list, with rows grouped by day (DayId). In addition, the view shows the amounts of employees (In) coming to the office.

This way we can have the rows in the list grouped by day.

Sum of the number of employees is also available for each day.

Utilizing the view in Flow
How could the data in this view be utilized in Flow? By using the SharePoint REST API. Paul Murana’s great blog has a good example of this, from which I have copied the structure.
For calling the API, we need
- SharePoint list name
- Id of the view
We can extract them from the URL, for example.

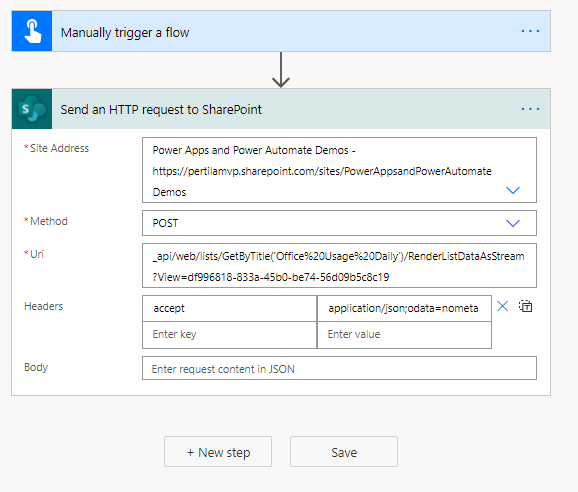
Let’s create a flow that retrieves the data from the view using Send an HTTP request to SharePoint action. The parameters of the action are:
- Site Address: The site that contains the list
- Method: POST
- Url: _api/web/lists/GetByTitle(LIST_NAME_HERE)/RenderListDataAsStream?View =VIEW_ID_HERE
- Headers: accept application/json;odata=nometa
The action returns a JSON, in which the Row section contains the data we are interested in. Each day has its own record that contains the daily sum of visitors (field_In.SUM.agg).

We are practically ready!
Formatting the results into a table
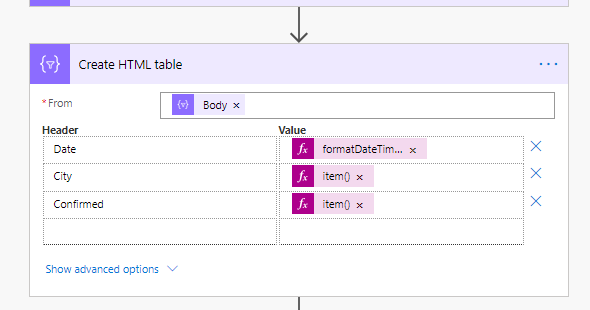
Finally, let’s use the Create HTML-table action to form a summary of the totals.
The content used by the action (From) is the Row table inside the return value (Body) of the previous action.
outputs('Send_an_HTTP_request_to_SharePoint')?['body']?['Row']DayId gets the value of the DayId field found in the Row section.
item()?['DayId']The sum is the daily sum found in the same place.
item()?['field_In.SUM.agg']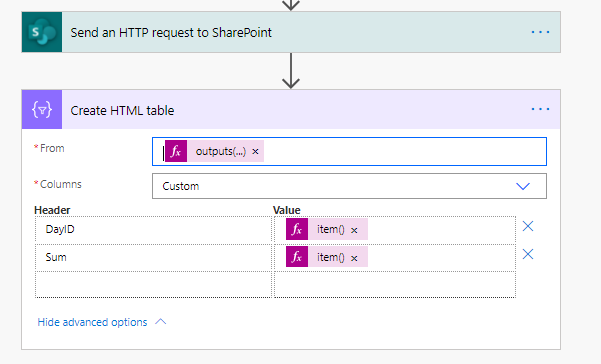
And we are ready.
We reached the same result with three actions that consume a total of three Power Platform requests.
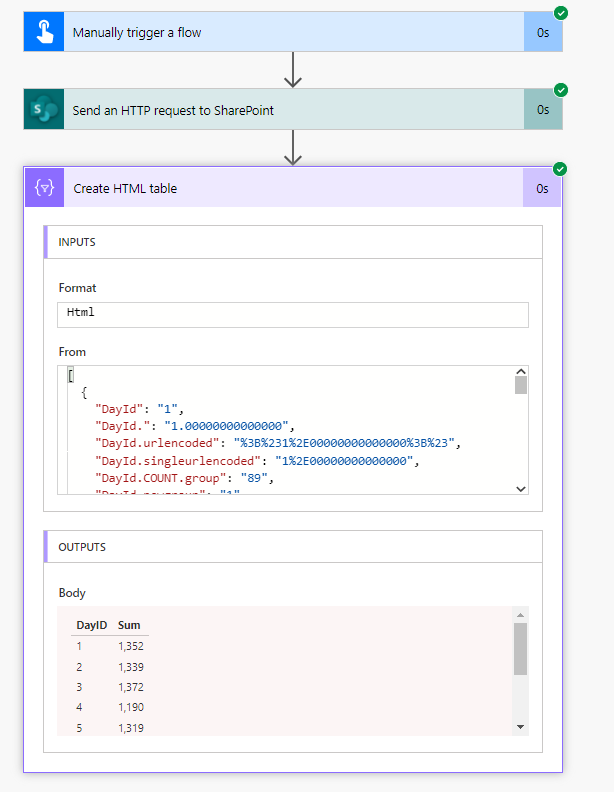
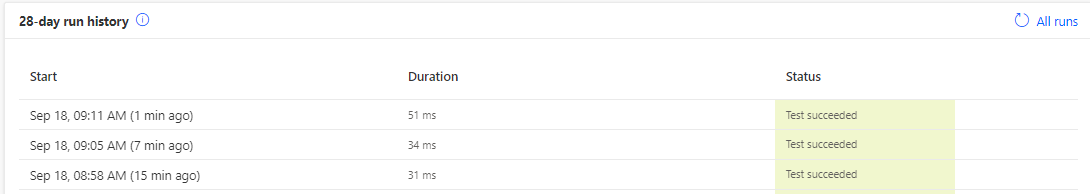
When implemented like this, it takes about 50 milliseconds to generate the sums.
Finishing
We want to send a daily visitor forecast for the next five days to the kitchen. Including the current day.
So we filter rows out of the returned view with the Filter array action.
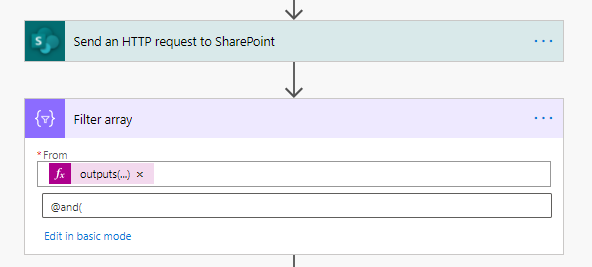
The filter condition looks a bit complicated.
@and(
  greaterOrEquals(
     int(item()?['DayId']),
     dayOfWeek(utcNow())
     ),
  less(
     int(item()?['DayId']),
     add(dayOfWeek(utcNow()),5)
     )
)
In practice, it filters the rows, whose
- DayId is greater than the current day’s number (obtained with the DayOfWeek function), but is also
- less than current day’s number +5
Finally, the mystical DayId‘s are replaced with real dates.

This is done with the following formula
formatDateTime(
   addDays(
      formatDateTime(utcNow(),'yyyy-MM-dd'),
      sub(
         if(greater(int(item()?['DayId']),5),
            add(int(item()?['DayId']),2),
            int(item()?['DayId'])),
         dayOfWeek(utcNow()))),
   'dd.MM. (ddd)'
)
Again, this looks a bit complex, but in practice we
- Subtract the current day’s number from DayId. This number of days will be added to the current day’s date. This way, for example on Wednesday (day number = 3) the value DayId = 4 on our list becomes a Thursday (current day +1). In the same way DayId = 5 becomes Friday.
- The important thing here is the weekend. If the DayId is greater than 5 (the day represents the following week), an additional 2 days are added to the current day, so that the rolling works correctly.
Now the flow run on Saturday (September 18) returns the following summary.

The final result can be sent to Teams, for example.

Where it looks like this with our example data.

Daily sums by city
What if the offices are in different cities?
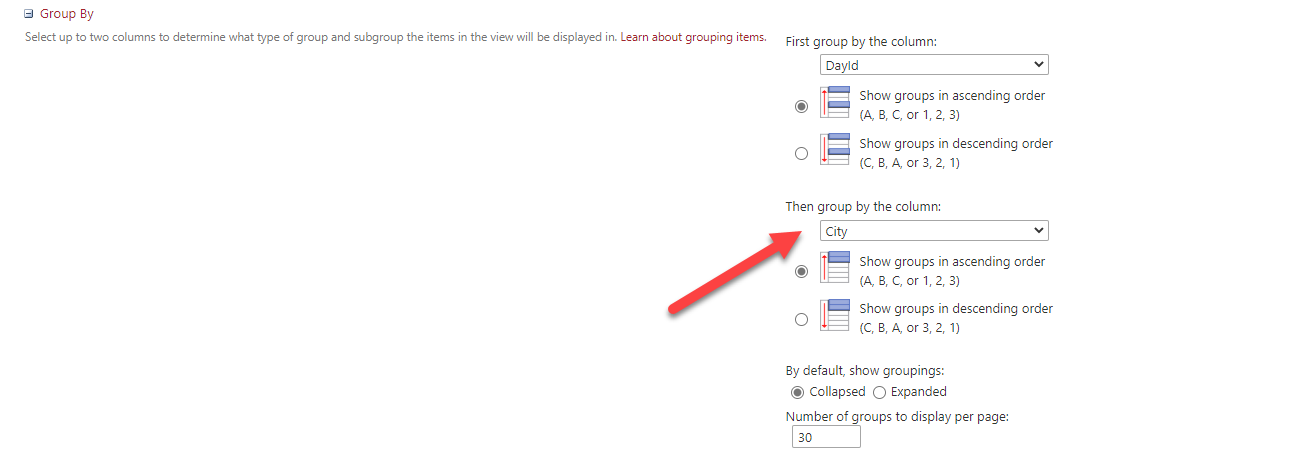
In this case, the daily summary should be compiled by the city. Let’s customize our view so that the rows are Grouped By primarily by day (DayId) and secondarily by City.
Now we can see the daily number of visitors for each city in our view.
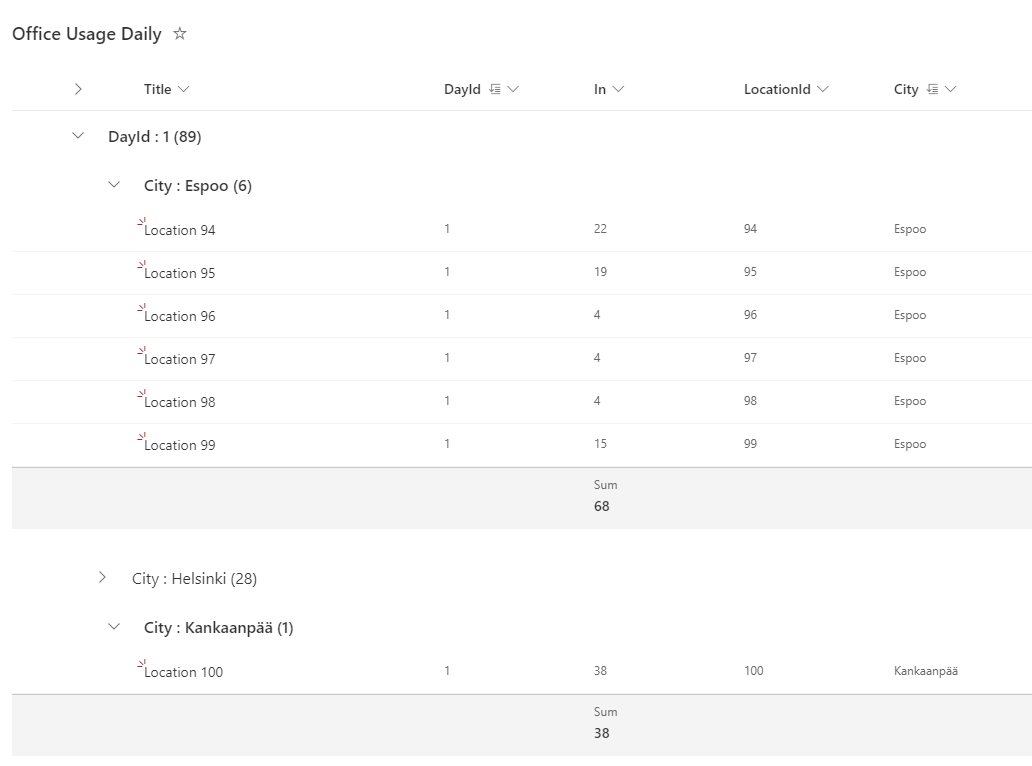
The return value of the SharePoint REST API changes slightly. Now there is a separate record for each city for each day. The number of visitors for each city can be found in the field_In.SUM.agg2 field.

Let’s include the city in the table and change the sum to field_In.SUM.agg2 .
Our Teams message now looks like this.

City-specific summary (Distinct in Flow using the Union function)
Of course, we want to send separate messages to the kitchens of different offices (cities).
For this, we need a list of cities. One where each city appears only once (distinct)
Let’s create (with the Select action) a set with only the cities from the sum list. The result set is Espoo, Helsinki, Tampere, etc. 10 times each.
A Union function is then performed with the resulting set.
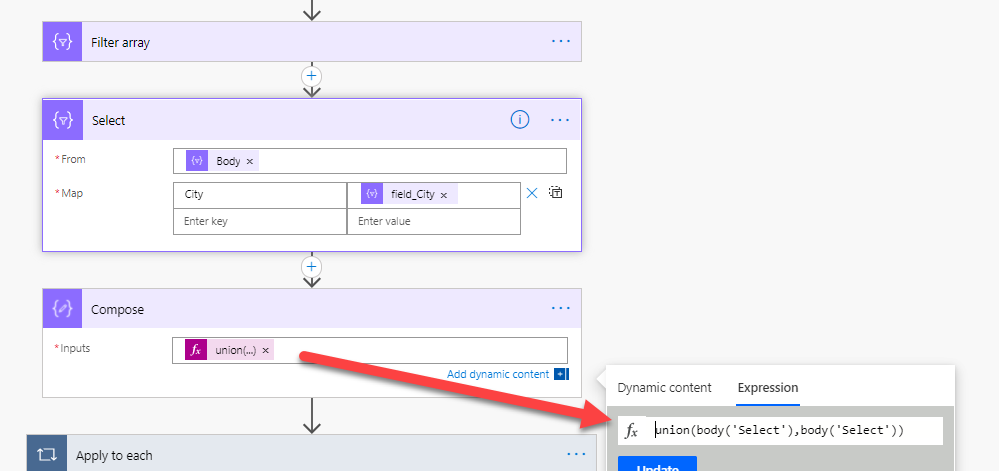
Now we have the cities nicely on their own table.
[
  {"City": "Espoo"},
  {"City": "Helsinki"},
  {"City": "Kankaanpää"},
  {"City": "Tampere"},
  {"City": "Turku"}
]
We need to go through the table one at a time and make a summary for each city.
To do this, we add the city to our filtering action condition.
equals(item()?['Field_City'],items('Apply_to_each')?['City'])
As a result, we have a summary for each city. We can send the summaries to different email addresses, or to different teams.

This is why ordinary users hate things like Power Automate.
i’ve been trying to figure this out off and on for a couple of months. Your solution is simple and overcomes some of the shortcomings of Power Automate.
Thanks for sharing!